What Is A Pivot Table Used For. Pivot tables are one of the most effective tools in MS Excel. With their help, you can convert a million rows of data into a concise report in a matter of seconds. In addition to quickly summarizing, pivot tables allow you to literally change the way analysis is done on the fly by dragging and dropping fields from one area of the report to another.
The Excel PivotTable is also one of the most underrated tools out there. Most users are unaware of what capabilities are in their hands. Let’s imagine that pivot tables have not yet been invented. You work for a company that sells its products to various clients. For simplicity, there are only 4 items in the range. The products are regularly bought by a couple of dozen customers who are located in different regions. Each transaction is entered into the database and represents a separate row.
What are pivot tables for in Excel?/What Is A Pivot Table Used For
Pivot tables in Excel are used to analyze data in greater detail and to answer immediate questions about the data worked.
In summary, understanding what pivot tables are for in Excel implies that you know that these Excel pivot tables have been specially created to help you:
- Answer queries in a simple way of large amounts of worked data.
- Summarize data by categories and subcategories.
- Obtain subtotals and sums of numerical data.
- Create custom or advanced formulasand calculations .
- Delve into the details of the data worked according to the area of interest.
- Expand and collapse data levels to highlight results.
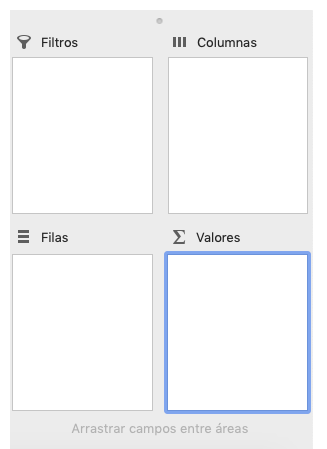
- View different summaries of the source data: move rows to columns or columns to rows (“pivot”).
- Filter, sort and group the most relevant data groups and format them conditionally.
- Submit reports online or in print.
Pivot tables are extremely important, in general everything we do in Excel we want to be dynamic, you will see why after explaining what happens if it is not dynamic, imagine that you have a price list and in this you add new prices to old products and new products, according to this you have a graph where you have total control of expenses.
Well, if it were not dynamic, this would be of no use, the difference between being dynamic or not is the difference between writing it down on your computer or on a napkin, it is quite clear that dynamism is crucial in the use of the PC and Excel in general but I’ll give you another example
Suppose you want to keep track of how many employees you have and you need them to be automatically added to a list where the payment that will be given at the end of the month is calculated because you pay them by merit and not by hours.
Then you need to update the number of jobs they did for you and their price, if this is not dynamic, you will have to redo the graph and the calculation of their payment at the end of the month, too much work, right?
When to use a pivot table?/What Is A Pivot Table Used For
Pivot tables are most often used in situations that require deep data analysis. Use an Excel pivot table when you have a spreadsheet with data that you want to analyze from different points of view.
If your data has records to group and compare between them, then it is a good indicator to make a pivot table. ?
- It is very useful for comparing, calculating, and summarizing data.
- Run automatic calculations with summed values.
- Create total or partial percentages.
- Segment the data by date, type or other variables.