Japanese candles are a form of graphical representation of the essential information of the price of a financial asset in a certain period of time.
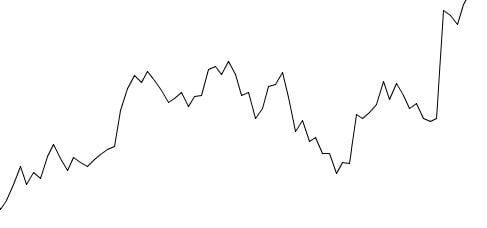
Japanese candles are an alternative to the usual graphical representation in the form of a line. The graphic representation in line form would be as follows:
The graph above shows the price of a financial asset in the form of a line, which is drawn by joining the closing prices at the end of each period. For example, a daily chart will represent the union of closing prices at the end of each day. If the chart were monthly, it would be formed by the closing prices at the end of each month. The only information that we can appreciate is the closing prices.
That said, there are different options for more price information with a simple glance at the chart. One of those options is the Japanese candle charts. Japanese candles, unlike line graphs, generally inform us of four parameters. They inform us of the opening, closing, maximum and minimum prices. In addition, to distinguish between bullish and bearish periods, the bodies of each candle are usually filled with different colors. Below is an example of a chart in the form of Japanese candles:

Japanese candle structure
As we have already said, Japanese candles have the main advantage of nourishing us with more information at a glance. Perhaps, at first, it may seem more complex. However, although this is actually the case, with time and experience it is much easier to analyze these types of charts. To learn how to interpret candlestick charts, we will explain the structure of candlesticks.
We can differentiate between bullish and bearish candlesticks. Incidentally, and for the sake of brevity, we will occasionally refer to the term “candles” as a synonym for Japanese candles. Bullish candles are colored white or green, while bearish candles are colored black or red.
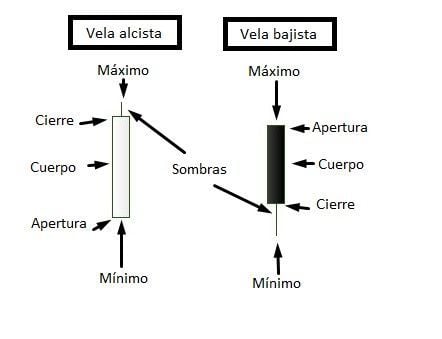
The structure of the Japanese candles is as follows:

What each part of the candle represents is explained below:
- Opening : It is the first price at which the financial asset is quoted in the reference period.
- Closing: It is the last price at which the financial asset is quoted in the reference period.
- Body: Set of prices that are between opening and closing in the period.
- Maximum: It is the highest price at which the asset has quoted in the reference period.
- Minimum: It is the lowest price at which the asset has quoted in the reference period.
- Shadow: It informs us of prices at which the asset has been quoted, but which are neither the closing price, nor the opening price, nor minimum nor maximum.
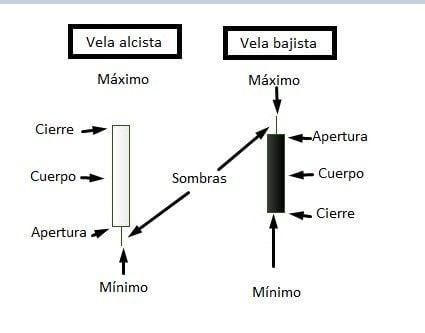
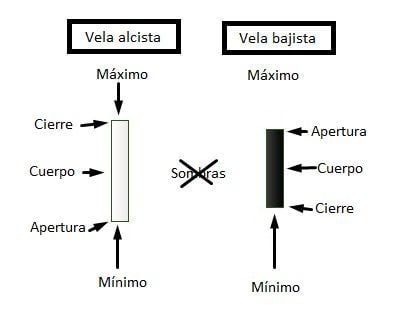
In this sense, we can find candles that do not have shadows. That is, with candles whose minimum or maximum is equal to the closing or opening price. They can have two shadows, they can have only one shadow, or they can have no shadow. So we will distinguish three cases:
- The close is equal to the maximum (bullish candles). The closing price is equal to the minimum (bearish candles)
- The opening price is equal to the minimum (bullish candles). The maximum equals the opening price (bearish candles)
- Opening and closing coincide with the maximum and minimum prices.
Japanese candle patterns
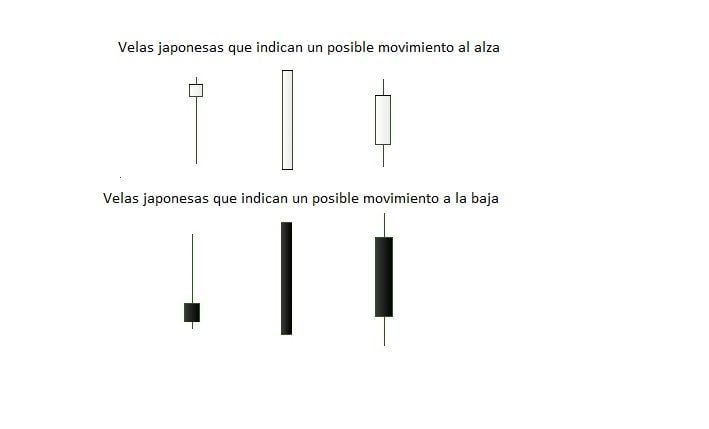
The reason why it is important to know the many forms that Japanese candles can take lies in their usefulness to analyze the price . That is, depending on the shape of a candle or a set of them, that will have implications. Japanese candlestick patterns are included within the technical analysis . More specifically, within chart analysis . While it is true, everything is said, that some analysts consider it a type of analysis in itself. Below is an example of Japanese candles with bullish and bearish implications.
Instead of independent candles, we can also highlight sets of candles. These sets of Japanese candles, as in the previous case, indicate that the price is likely to take one direction or the other
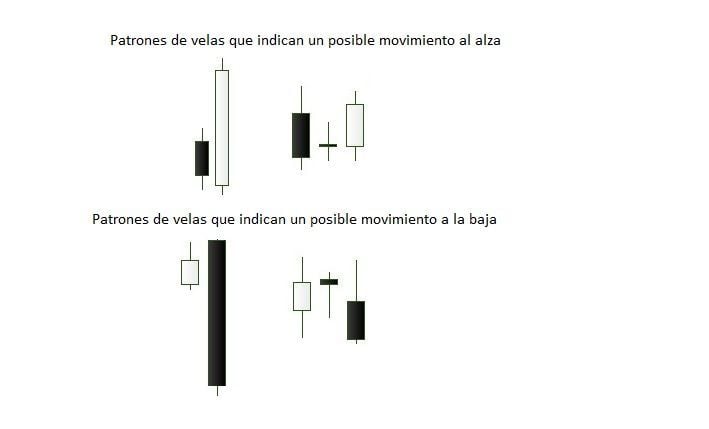
The patterns discussed above are well-studied patterns. That is, each pattern has an explanation. There is an extensive literature on the subject with hundreds of patterns. More important than the patterns themselves, is the context in which they occur. In other words, the validity and importance of the patterns depends on the point of the trend in which they appear. Thus, the patterns seen are very simple examples that by themselves do not mean too much. Additionally, some analysts combine this analysis with other tools such as stock volume .
Finally, it is essential to highlight two issues. The first question is that, like all types of analysis , it is not infallible. That is, it indicates that a movement is likely to occur. And therefore, being probable is not certain. The second issue has to do with that the patterns are not perfect. That is, they do not always happen with exactly the same appearance as the examples. Thus, mastering the analysis of candlesticks takes time and experience.