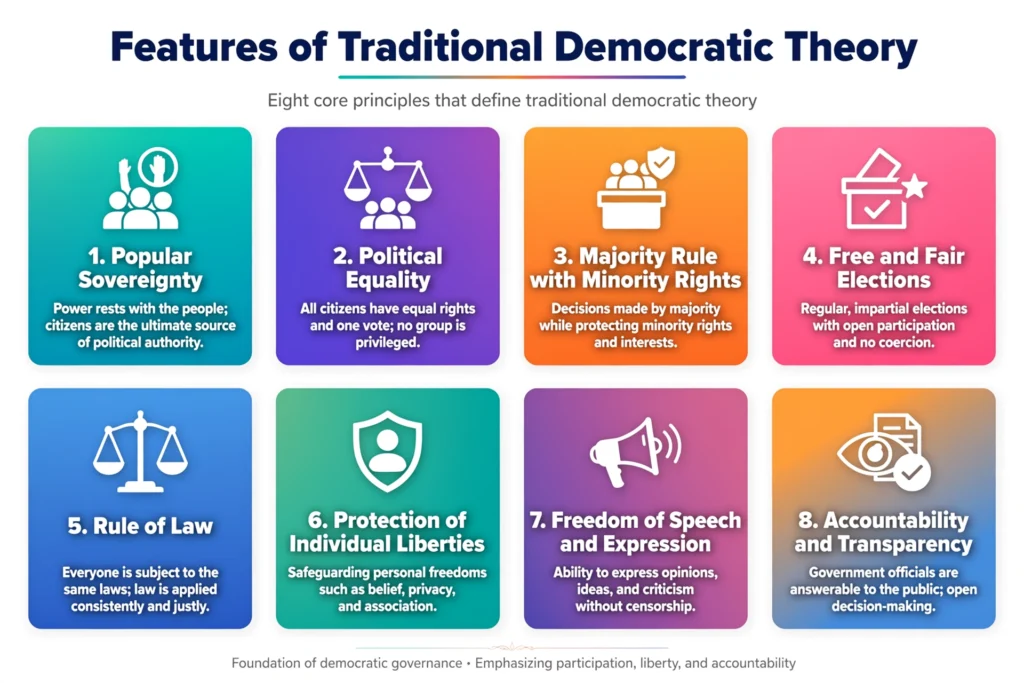
An ideogram is a graphic representation that summarizes data or concepts. Find out how to create one here: data collection, organization in a table and use of symbols.
Introduction
An ideogram is a graphic representation that summarizes data or concepts in an immediate and intuitive way . When we talk about concepts, the ideograms of the Chinese language often come to mind, which graphically represent one or more concepts through symbols that recall logical or pictographic connections.
In the statistical-mathematical field, an ideogram is a symbolic diagram useful for representing numerical or qualitative data related to sectors such as algebra, geometry, physics, statistics, geography, history and many other disciplines.
This guide will show you how to make an ideogram to represent data in a statistical-mathematical form .
Data collection
The first step is to collect the necessary data , organizing them according to the graph’s objective.
For example, if you want to represent the world production of bananas, it is important to collect information, such as: the producing countries and the quantity produced in a given period. This data will be the basis of the graph.
Table organization
After collecting the data, the next step is to arrange it in a table. Organize the data in an order , such as ascending or descending, to make it easier to read and understand.
For example, in the “Country” column, you can enter “Ecuador” and, next to it, in the “Production” column, the quantity of bananas produced. Each row will represent a country with its respective production.
Adding graphic and symbolic elements
Once the table is completed, it can be enriched with graphic elements, such as symbols, drawings or icons . These must be chosen in such a way as to highlight the most important data and make the graph more intuitive and attractive.
For example, you can use stylized images of bananas next to numbers to emphasize the quantities produced.
Conclusion
By following these steps, you will be able to create a clear and understandable ideogram that communicates data effectively and immediately. Thanks to its flexible structure, the ideogram can be enriched and adapted to different contexts , becoming a useful tool in many disciplines. Its ability to visually summarize information makes it ideal for representing complex concepts in a simple and intuitive way