How to make pie chart in Excel.Ever wanted to make a simple pie chart in Excel.Pie charts are very simple to create.Graphs can make it easier to understand the data you are presenting. For example in a pie chart, each slice is an item represented on the chart, and they all add up to 100% of the pie.
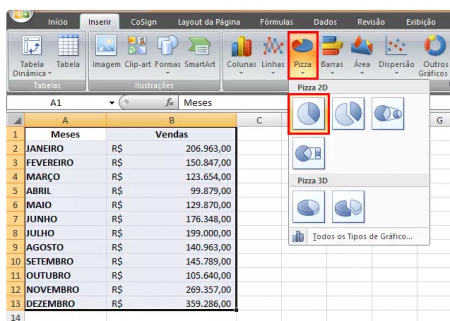
Select the table data and locate, on the Insert tab , the Pizza option . When clicking on it, some creation options will be presented: 2D or 3D .
How to make pie chart in Excel
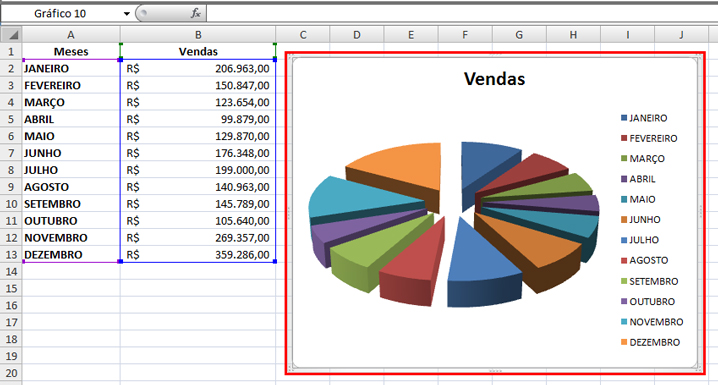
We will choose, first, the first frame format presented, where the 2D graphics options are found, which consist of a simpler construction model.
See that the chart will be ready, with organized title and captions.
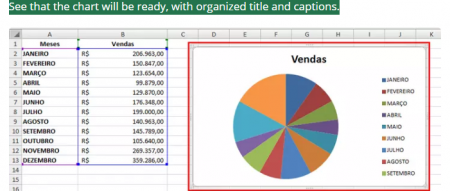
TIP: Note that the returned chart is perfect, as the data was already allocated in the table before its creation, however, if we had clicked on insert the chart without having the data, we would have to edit them manually, which could cause an error in the information. Therefore, before creating any charts, have the data already transcribed in the table.
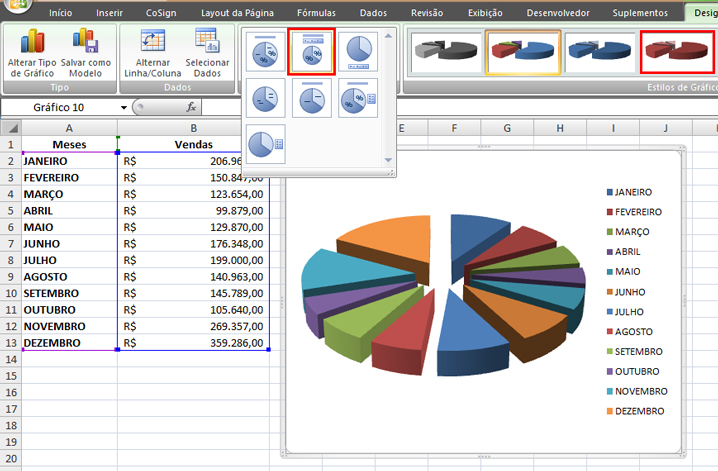
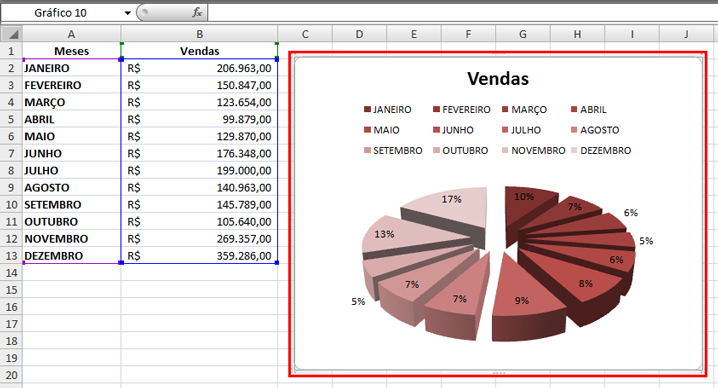
After the construction of the chart, the upper Excel toolbar will present some forms of editing and formatting, where there are different ways of coloring and organizing the information.

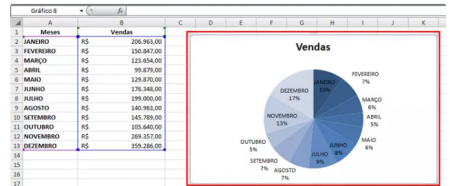
As a new data arrangement format, we will opt for the percentage method, along with the blue gradient coloring.

See that now the data is better to be analyzed, as it shows the percentage of sales for each month, based on the total value of these.
Another very interesting format to work with is where some information is transformed into another pie, improving its visualization. To do this, mark the data and select the required option; now, with regard to coloring, click on the indicative arrow and choose one of the different shapes offered.
Another very interesting format to work with is where some information is transformed into another pie, improving its visualization. To do this, mark the data and select the required option; now, with regard to coloring, click on the indicative arrow and choose one of the different shapes offered.


How to make pie chart in Excel 3d
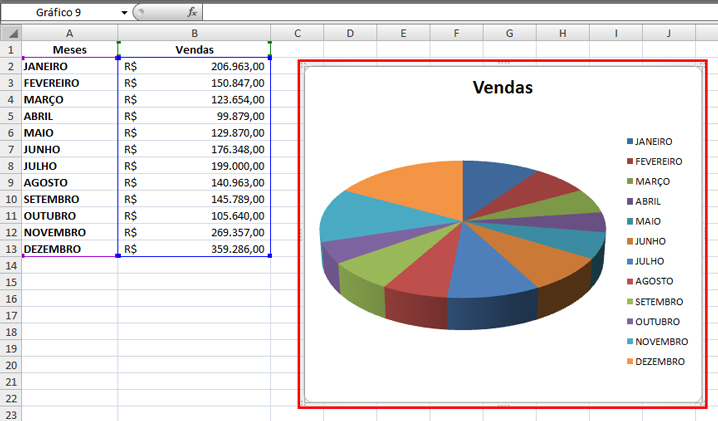
Pie shapes in 3D basically consist of bolder graphics with different positions, giving a third-dimensional impression. This method doesn’t differ much from your previous one, but it’s more interesting. However, this method only presents two options to choose from.
Using the same table as a base, mark all the data and in the Pie icon on the Insert tab , choose one of the formats in the 3D frame.


Note: If the data does not appear completely in the chart frame, it is necessary to expand it by clicking on one of its corners and dragging it to the desired size.

In your editing and formatting toolbox, this format has the same options as the previous one. By clicking on the arrow indicating if you have access to some more models of options, choose one of these and opt for a new coloration.


Now let’s look at the other available format. For that, delete this chart and let’s start another one, this time opting for the new format.

Note that this one doesn’t have many differences, only the data components will no longer be together on the circle, but separate.
Now choose a formatting option, percentage for example, and a coloring for the graph.
Note that the chart was redesigned and with an easier way of interpreting the data contained in it.
However, creating pie charts is not as complicated as it might seem. The more the user practices, creating creative documents, the more he will adapt and acquire more knowledge and familiarity with the functionality and facilities offered by this brilliant tool.