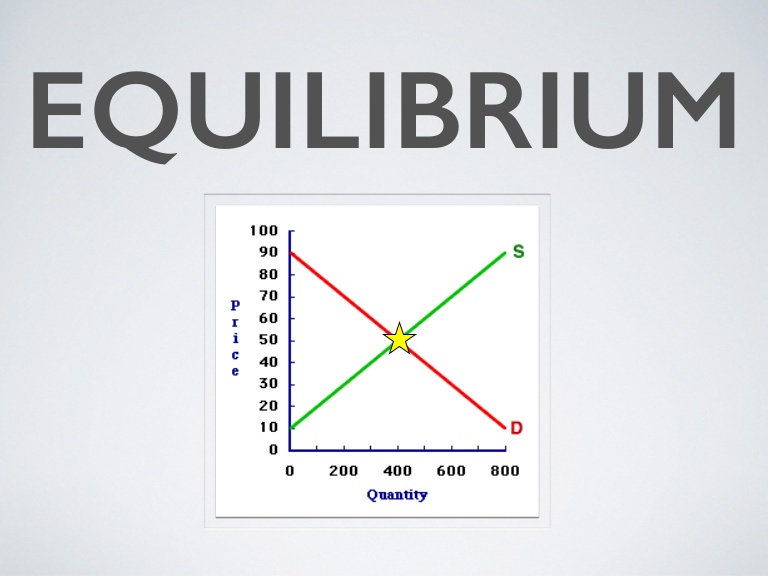
The equilibrium price is the price that equals the quantity offered and the quantity demanded of an economic good on the market. The equilibrium price is a meeting point between supply and demand. On the other hand, a market characterized by a scarcity of demand and a high supply, has a very low equilibrium price.
Market forces push the price towards its equilibrium condition. For example, when demand is higher than supply (D ‘> S’), the market price of the asset tends to increase to the equilibrium level. Price increase reduces buyer demand and incentives sellers to increase supply The process of dynamic adjustment of demanded quantity and supply ends when the market reaches equilibrium price (p e ).
When the supply exceeds the demand (S ‘> D’), the market price of the asset tends to decrease to the equilibrium level. The dynamic adjustment process ends when the price reaches its equilibrium level (p e ) in which demand and supply are equal.
At the price p ‘the quantity demanded of the good (q D ) is lower than the quantity offered of the same (q S ). The sellers progressively reduce the price to avoid unsold stocks. The price reduction increases the quantity demanded from q D to Q * and reduces the quantity offered by q S to Q . In point q the quantity demanded and offered is equal (market equilibrium) at the equilibrium price.
Equilibrium Price And Law of Demand
Here’s a guide to what such a table might look like:
- Demand Column: Lists different quantities of a good that consumers are willing to purchase at various prices.
- Supply Column: Shows different quantities of the good that producers are willing to sell at these prices.
- Price Column: Enumerates different potential prices for the good.
- Equilibrium Point: Highlighted in the table. This is the price at which the quantity demanded equals the quantity supplied.
An example table:
| Price (P) | Quantity Demanded (Qd) | Quantity Supplied (Qs) | Market Status |
|---|---|---|---|
| $10 | 100 units | 500 units | Surplus (Qs > Qd) |
| $8 | 200 units | 400 units | Surplus (Qs > Qd) |
| $6 | 300 units | 300 units | Equilibrium (Qs=Qd) |
| $4 | 400 units | 200 units | Shortage (Qd > Qs) |
| $2 | 500 units | 100 units | Shortage (Qd > Qs) |
In this table:
- When the price is high ($10), the quantity supplied exceeds the quantity demanded, leading to a surplus.
- As the price decreases, the quantity demanded increases while the quantity supplied decreases.
- At $6, the quantity demanded equals the quantity supplied, indicating the equilibrium price.
- Below this price, there’s a shortage, as the quantity demanded exceeds the quantity supplied.
This table format helps visualize how the equilibrium price is determined in a market by the intersection of demand and supply.
In conclusion, the equilibrium price is a fundamental concept in economics. It represents a point of balance between supply and demand, enabling efficient resource allocation and market stability. By understanding the factors that influence its determination, stakeholders can make informed decisions and navigate the complexities of the market.